How Do I Make An Ogive In Excel A Complete Walkthrough
An ogive is a powerful cumulative frequency graph that helps you visualize data trends in Excel. This guide walks you through every step to create an ogive chart from scratch. You will learn how to set up your data, choose the right chart type, and read your ogive like an expert. Whether you are a student or a data analyst, this tutorial makes it simple.
Have you ever stared at a spreadsheet full of numbers and wondered how to turn it into something meaningful? If you have been searching for how do I make an ogive in Excel, you are in the right place. An ogive is a type of chart that shows cumulative frequencies. It helps you see patterns in grouped data at a glance. This complete walkthrough will take you from raw numbers to a polished ogive chart in just a few minutes.
You do not need to be a math wizard or an Excel expert to follow along. We will break every step into simple, easy-to-follow instructions. By the end of this guide, you will know how to set up your data, build the chart, and interpret the results with confidence. Let us dive right in.
Key Takeaways
- An ogive shows cumulative frequencies: It is a line graph that plots cumulative totals against class boundaries, making trends easy to spot.
- Excel makes it simple: You only need a frequency table and a scatter plot to build a professional-looking ogive.
- Less than and more than ogives exist: Both types serve different purposes and give unique insights into your data.
- Setting up data correctly is key: Errors in class boundaries or cumulative totals will throw off your entire graph.
- Customization improves clarity: Adding axis labels, gridlines, and trend lines makes your ogive easier to read and present.
- Ogives help find medians and percentiles: You can estimate important statistical values directly from the curve.
- Avoid common formatting mistakes: Skipping boundaries or using the wrong chart type are the top errors beginners make.
📑 Table of Contents
- What Is an Ogive and Why Does It Matter?
- Setting Up Your Data in Excel
- Creating the Ogive Chart in Excel Step by Step
- Less Than Ogive vs More Than Ogive
- Reading and Interpreting Your Ogive
- Common Mistakes When Making an Ogive in Excel
- Pro Tips for Perfect Ogive Charts in Excel
- Advanced Ogive Techniques in Excel
- Why Excel Is Great for Building Ogives
- Conclusion
What Is an Ogive and Why Does It Matter?
An ogive is a line graph that displays cumulative frequencies. Instead of showing individual data points, it plots running totals against class boundaries. This makes it easy to see how values accumulate across a range. The word “ogive” comes from architecture, where it describes a pointed arch. In statistics, it has become the standard term for this type of cumulative curve.
People use ogives for many reasons. They help find medians, quartiles, and percentiles at a glance. Teachers use them in math and science classes. Business analysts use them to track performance trends. Researchers rely on ogives to present grouped data clearly. No matter your field, knowing how to create one in Excel is a valuable skill.
Types of Ogives
There are two main types of ogive charts. Understanding both will help you choose the right one for your data.
- Less than ogive: This type adds frequencies from the lowest class upward. It shows how many values fall below each upper class boundary.
- More than ogive: This type adds frequencies from the highest class downward. It shows how many values fall above each lower class boundary.
Both ogive curves are useful. Often, people plot them on the same graph to find the median where the two lines cross. This is a powerful trick that we will explore later in this guide.
Setting Up Your Data in Excel
Before you build the chart, you need to organize your data correctly. This step is the most important part of the entire process. If your data is not set up right, the ogive will not make sense. Follow these steps carefully.
Step 1: Create a Frequency Table
Start by listing your class intervals and their frequencies. A class interval is a range of values grouped together. For example, test scores from 0 to 10, 11 to 20, and so on. Your frequency is how many data points fall into each range.
Here is a simple example to follow along with:
- Class Interval: 0-10, Frequency: 5
- Class Interval: 11-20, Frequency: 12
- Class Interval: 21-30, Frequency: 20
- Class Interval: 31-40, Frequency: 10
- Class Interval: 41-50, Frequency: 3
Step 2: Calculate Cumulative Frequencies
Next, add a column for cumulative frequencies. Start with the first frequency value. Then, add each subsequent frequency to the running total. Your final cumulative frequency should equal the total number of data points you have.
For the example above, your cumulative frequencies would look like this:
- 0-10: 5
- 11-20: 17 (5 + 12)
- 21-30: 37 (17 + 20)
- 31-40: 47 (37 + 10)
- 41-50: 50 (47 + 3)
Step 3: Determine Upper Class Boundaries
This is where many people make mistakes. An upper class boundary is the highest value that can belong to each class interval. For whole number data, you add 0.5 to the upper limit. So for the interval 0-10, the upper boundary is 10.5. For 11-20, it is 20.5. And so on.
Create a third column with these boundary values. You will plot these on your horizontal axis when you build the ogive.
Quick Tip: Always double-check your upper class boundaries before plotting. A small error here will shift your entire ogive curve and give you wrong results.
Creating the Ogive Chart in Excel Step by Step
Now comes the fun part. You will use Excel’s chart tools to build your ogive. Follow each step closely and you will have a professional-looking graph in no time.
Step 1: Select Your Data
Highlight the two columns you need: the upper class boundaries and the cumulative frequencies. Make sure you do not include the class interval column. Excel needs only the boundary values and their corresponding cumulative totals.
Step 2: Insert a Scatter Plot
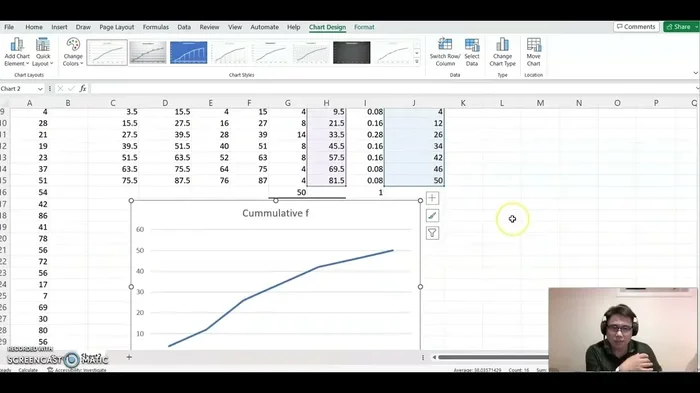
Go to the Insert tab on the Excel ribbon. Click on the Scatter chart option. Choose the scatter plot with smooth lines and markers. This is the best chart type for an ogive because it connects your data points with a continuous curve.
Do not use a line chart. A line chart treats the horizontal axis as evenly spaced categories. A scatter plot treats it as actual numerical values, which is what you need for accurate ogive graphs.
Step 3: Format Your Axes
Right-click on each axis to format it. Set the horizontal axis minimum to match your first class boundary. Set the maximum to match your last boundary. This ensures your ogive fills the chart area properly and is easy to read.
Add axis labels too. The horizontal axis should be labeled with what your class boundaries represent, such as “Test Score” or “Time (minutes).” The vertical axis should be labeled “Cumulative Frequency.”
Step 4: Add a Chart Title
Click on the chart title and give it a clear name. Something like “Cumulative Frequency Ogive” works well. A good title helps anyone reading your chart understand what they are looking at immediately.
Expert Insight: The secret to a great ogive in Excel is not just the chart type. It is the accuracy of your data setup. Spend extra time on your cumulative frequency column and upper class boundaries. Everything else flows from there.
Less Than Ogive vs More Than Ogive
Both types of ogive charts are built in Excel the same way. The difference lies in which data you plot and how you calculate your running totals. Understanding both gives you a fuller picture of your data distribution.
Building a Less Than Ogive
A less than ogive plots upper class boundaries on the horizontal axis and cumulative frequencies on the vertical axis. The curve always rises from left to right. It starts near zero and ends at the total frequency count.
This is the most common type of ogive. It answers the question: “How many values are less than or equal to this boundary?” It is perfect for finding percentiles and understanding where most of your data falls.
Building a More Than Ogive
A more than ogive plots lower class boundaries on the horizontal axis. Instead of adding frequencies from the bottom up, you subtract from the total. Start with the total frequency and subtract each class frequency as you move down the table.
This curve falls from left to right. It answers the question: “How many values are more than or equal to this boundary?” It is useful for understanding the upper end of your data distribution.
Comparing Both on One Chart
Plotting both ogives on the same graph is a great way to find the median. The point where the two lines cross gives you the median value. This is one of the most practical applications of ogive charts in Excel.
| Feature | Less Than Ogive | More Than Ogive |
|---|---|---|
| Horizontal Axis | Upper class boundaries | Lower class boundaries |
| Vertical Axis | Cumulative frequency (bottom up) | Cumulative frequency (top down) |
| Curve Direction | Rising left to right | Falling left to right |
| Best For | Finding percentiles below a value | Finding values above a threshold |
| Median Finding | Use with more than ogive | Use with less than ogive |
Reading and Interpreting Your Ogive
Building the chart is only half the battle. Knowing how to read an ogive is what makes it truly useful. Let us walk through the key things you can learn from your cumulative frequency graph.
Finding the Median
The median is the middle value of your data set. On an ogive, find the point on the vertical axis that equals half your total frequency. Draw a horizontal line to the curve, then drop straight down to the horizontal axis. The value you land on is your median.
Finding Quartiles
The first quartile (Q1) is at 25% of the total frequency. The third quartile (Q3) is at 75%. Find these points on the vertical axis and follow the same process. The distance between Q1 and Q3 is called the interquartile range, which measures how spread out your data is.
Estimating Percentiles
Ogives make percentile estimation very easy. Simply find the percentage you want on the vertical axis, draw across to the curve, and drop down. The value on the horizontal axis tells you the percentile. This is incredibly useful for standardized test scores and performance analysis.
Quick Tip: Always label your percentile lines on the graph if you plan to share it with others. This makes your ogive much easier to understand for any audience.
Common Mistakes When Making an Ogive in Excel
Even experienced Excel users make errors when building ogive charts. Here are the most common mistakes and how to avoid them.
Using the Wrong Chart Type
The biggest mistake is choosing a line chart instead of a scatter plot. A line chart spaces your data points evenly regardless of their actual values. A scatter plot uses the real numerical values on both axes. Always choose scatter plot with smooth lines for your ogive.
Skipping Upper Class Boundaries
Some people plot the upper limits of each class interval instead of the actual boundaries. For whole number data, this means your ogive will be shifted by 0.5 on the horizontal axis. This small error can lead to wrong median and percentile estimates.
Forgetting to Start at Zero
Your cumulative frequency column should always start at the first frequency value, not at zero. However, your graph should include the point where cumulative frequency equals zero at the lower boundary of your first class. This ensures the curve starts correctly.
Mislabeling the Axes
Unlabeled axes make your ogive confusing and unprofessional. Always include clear labels with units. If your data represents test scores out of 50, say so on the horizontal axis. If cumulative frequency represents student counts, make that clear on the vertical axis.
Pro Tips for Perfect Ogive Charts in Excel
Once you have the basics down, these tips will take your ogive charts to the next level.
- Add gridlines: Light gridlines make it easier to read values from your ogive. Go to Chart Elements and check the gridline box.
- Use different colors: If you plot both a less than and more than ogive, use contrasting colors. This makes the intersection point easy to spot.
- Add data labels: Right-click your data points and add labels. This helps viewers see exact values without guessing from the graph.
- Save as a template: Once you create a great ogive, save it as a chart template. Next time, you can apply the same formatting instantly.
- Combine with a histogram: Place your ogive next to a histogram of the same data. This gives a complete picture of both the distribution shape and cumulative trends.
Expert Insight: The best ogive charts tell a story. Do not just build the graph and leave it. Add a clear title, meaningful axis labels, and annotations at key points like the median. These small touches make a huge difference in how your data is received.
Advanced Ogive Techniques in Excel
Once you are comfortable with the basics, you can explore some advanced techniques. These will make your ogive charts more powerful and informative.
Adding a Trend Line
Right-click on your data series and select “Add Trendline.” Choose the polynomial option for a smoother curve. This is especially helpful when you have many data points and the ogive looks jagged. A trend line makes the cumulative pattern easier to read at a glance.
Using Excel Tables for Dynamic Updates
Format your data as an Excel Table before building the chart. When you add new data rows, the table expands automatically. Your ogive chart will update too, saving you from rebuilding it every time your data changes.
Creating a Relative Cumulative Frequency Ogive
Instead of plotting raw cumulative frequencies, divide each value by the total to get relative frequencies expressed as percentages. This makes it easy to compare ogives from different data sets, even if they have different total counts.
Why Excel Is Great for Building Ogives
Excel is one of the most accessible tools for creating ogive charts. You do not need expensive statistical software. Most people already have Excel installed on their computers. The built-in chart features handle scatter plots and line graphs with ease. Plus, Excel lets you customize every detail of your graph, from colors to axis scales.
Another advantage is that Excel works with your existing data. You do not need to reformat or move your data anywhere else. Just set up your frequency table, calculate cumulative totals, and insert the chart. The entire process takes less than five minutes once you know the steps.
For students working on homework or research projects, Excel ogives are a lifesaver. Teachers often accept Excel charts as valid statistical work. For professionals, Excel ogives integrate easily into reports and presentations. You can copy the chart directly into Word or PowerPoint without losing quality.
The key is practice. The more ogives you build in Excel, the faster and more accurate you will become. Start with simple data sets and work your way up to more complex ones. Before long, you will be able to create a perfect ogive in just a couple of minutes.
Conclusion
Learning how do I make an ogive in Excel is easier than you might think. The process comes down to three main steps: setting up your frequency data with upper class boundaries, calculating cumulative totals, and inserting a scatter plot with smooth lines. Once you have the chart, you can use it to find medians, quartiles, and percentiles with confidence.
Remember to avoid the common pitfalls we covered. Use a scatter plot, not a line chart. Always plot upper class boundaries correctly. Label your axes clearly. And take advantage of the pro tips to make your ogive charts stand out.
Whether you are analyzing test scores, tracking sales data, or working on a school project, the ogive is one of the most useful tools in your data analysis toolkit. Excel makes it accessible to everyone. So open your spreadsheet, follow the steps in this guide, and start building ogives that tell clear, compelling stories with your data.
Now that you know the complete process, try building your own ogive today. You will be surprised how quickly it becomes second nature. Happy charting!
Frequently Asked Questions
What is an ogive chart used for in Excel?
An ogive chart in Excel is used to display cumulative frequencies for grouped data. It helps you visualize how values accumulate across class intervals. You can use it to find medians, quartiles, and percentiles quickly.
Can I make an ogive in Excel without a scatter plot?
You should always use a scatter plot for an ogive. A regular line chart treats the horizontal axis as categories, not numerical values. This distorts the curve and gives inaccurate results. The scatter plot with smooth lines is the correct choice.
What is the difference between a less than and more than ogive?
A less than ogive plots upper class boundaries and adds frequencies from the bottom up. A more than ogive plots lower class boundaries and subtracts frequencies from the total down. Both show cumulative data but in opposite directions.
How do I find the median on an ogive in Excel?
Find half of your total frequency on the vertical axis. Draw a horizontal line to the ogive curve, then drop straight down to the horizontal axis. The value you reach is the median. You can also find it where a less than and more than ogive cross.
Do I need upper class boundaries for an ogive?
Yes, upper class boundaries are essential. They represent the true end point of each class interval. For whole number data, add 0.5 to the upper limit. Without correct boundaries, your ogive will be shifted and your readings will be wrong.
Can I create a relative frequency ogive in Excel?
Absolutely. Divide each cumulative frequency by your total count to get relative cumulative frequencies as percentages. This is useful when comparing data sets of different sizes. The process for building the chart stays the same.